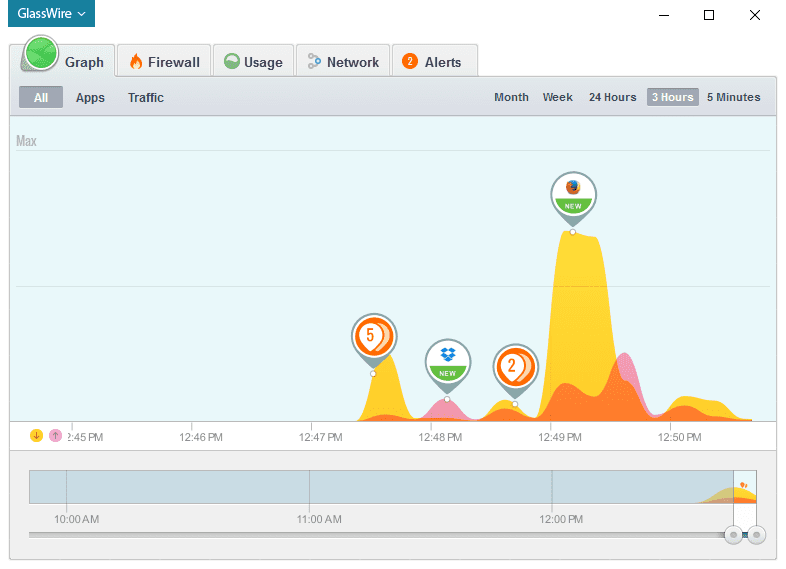
One of the most popular things about GlassWire is our network time machine feature. GlassWire allows you to go back in time to see network usage details at specific dates and times. For example if you see a network spike on GlassWire’s graph from while you were away from your computer, or even two days ago you can drill down to that day/time and click the graph to see what apps and hosts caused the change. Basic, Pro, and Elite GlassWire users can go back in time on even much larger scales from months to years. When we first launched GlassWire we were very excited about this feature and our users were too because we haven’t seen any other software that can do this. Over time we learned why nobody else had a network time machine feature. It’s because implementing this feature is very hard!

Soon our users began to complain about GlassWire using too much memory, and in some cases GlassWire’s service would crash and stop working due to a 2GB memory limit with Windows itself. Most normal GlassWire users wouldn’t see this problem but heavy BitTorrent users were constantly complaining because they would access thousands of hosts simultaneously. All this BitTorrent network data would cause GlassWire’s memory usage to steadily increase until its service would fail to function. On our message board and at our helpdesk we’d often have to ask users to uninstall GlassWire, then reinstall, or delete their history to fix this problem. Obviously this was not a good solution and we felt terrible recommending this to our users.
We realized we had to solve the problem but we weren’t sure what to do. Our team tested different options and finally came up with a solution. Unfortunately this solution meant that we had to rewrite GlassWire to completely change how it stored and accessed host data for the graph. This was a tough pill to swallow but we put our heads down and over several months we made it happen with GlassWire 1.2.
You’re probably wondering how GlassWire 1.2 is different than our previous versions. This new version of GlassWire only requests the amount of host data needed to draw the graph for its selected time period so it uses much less memory. GlassWire keeps the data it isn’t currently using in a cache that it can access at any time. We tried to make these changes invisible to most users but you may see “loading data…” occasionally when accessing some data over long time periods. For example the “Usage” tab may sometimes say “loading data” when it’s updating. This brief delay to load data allows GlassWire to access and display the data you need while keeping overall memory usage much lower than it was before. You may also notice how we broke up GlassWire’s database into several sections to make it load more efficiently.
We feel the minimal delay to “load” data is worth the trade off to keep GlassWire’s overall memory footprint much lower and we hope you feel the same way. Please note that over time as we optimize GlassWire further these “loading…” events should decrease more and more.
We’d like to thank our alpha testing team who helped us find bugs in this new unreleased version. Without their help our jobs would have been a lot more difficult and taken a lot longer.
If you haven’t already please try GlassWire 1.2 and check out the memory optimizations, along with many other improvements including optimizations for Microsoft Surface tablets, improvements in our data counter on the main graph, Turkish language support, plus many other bug fixes and optimizations.
Thank you for your support and patience while our team worked hard on this major rewrite of GlassWire. Now we have a stable base to move forward and continue to improve. As always, if you have anything to say please let us know on Twitter or our forum so we can get your feedback.
Sincerely, The GlassWire Team
GlassWire 1.2 Download – Change List


